- HubPages»
- Education and Science»
- Linguistics»
- English as a Foreign or Second Language
Task 1 IELTS Writing Model - Line Chart

Cambridge 7 Test 2
Task 1 IELTS Writing Model - Line Chart
IELTS(International English Language Testing System) is the world's leading test of English for higher education, immigration and employment. Below is a model for IELTS Writing Task 1 for Line Charts.
Question:
You should spend about 20 minutes on this task.
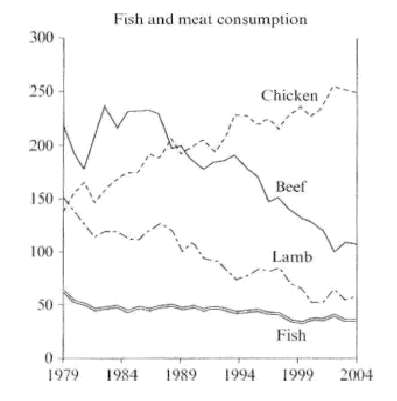
The graph below shows the consumption of fish and different kinds of meat in a European country between 1979 and 2004.
Summarise the information by selecting and reporting the main features and make comparisons where relevant.
Answer:
What the line chart focuses on is the information about the amount of chicken, beef, lamb and fish consumed by citizens in a particular country in Europe during 25 years since 1979.
The trends of beef and lamb are alike. In terms of beef, the quantity was initially roughly 220 grams per person per week. Then, it sharply fell to 170 grams. However, in 1982, the figures soared, arriving at the climax with 225 grams. Since then, the consumption declined steadily, reaching approximately 100 grams in 2004. Similarly, the consumption of lamb experienced the same declining trend, from 150 grams in 1979 to about 50 grams in 2004.
In contrast, the situation of chicken is completely different. In 1979, the data were 150 grams, similar to that of lamb. However, since then the number rose moderately, surpassing beef in 1989 and being the most popular meat. In 2004, the amount of chicken consumed by people peaked at 250 grams.
In terms of fish, although it was the least popular, consumption levels were the most stable.
Overall, the amount shows that the consumption of chicken went up sharply whereas the popularity of the other meats declined over the given period.


